Chapter 4
BSP & BOP Strategy Examples
Following are examples of close-to-close and open-to-close betting using either BSP or BOP strategies, whichever is most profitable. Time span is beginning of 2010 to 2011-04-01 (April 1, 2011), which is 314 trading days. Plots for SPY, TLT, and GLD are BOP, while USO is BSP. The solid line shows the profit or loss per share on a cumulative basis and always starts at zero. Trading costs are not included since it depends on the broker, but as long as you stick to one broker, it's a constant, and can just be subtracted from the final result. The dotted line shows the daily closing price. The scale for profit per share is on the left and the closing price scale is on the right.
Note that while only one strategy is shown, you can see what the other strategy would do by reflecting the profit/loss plot about the zero line. This means that if profits climb for the BOP strategy then they would fall for the BSP strategy and vice versa.
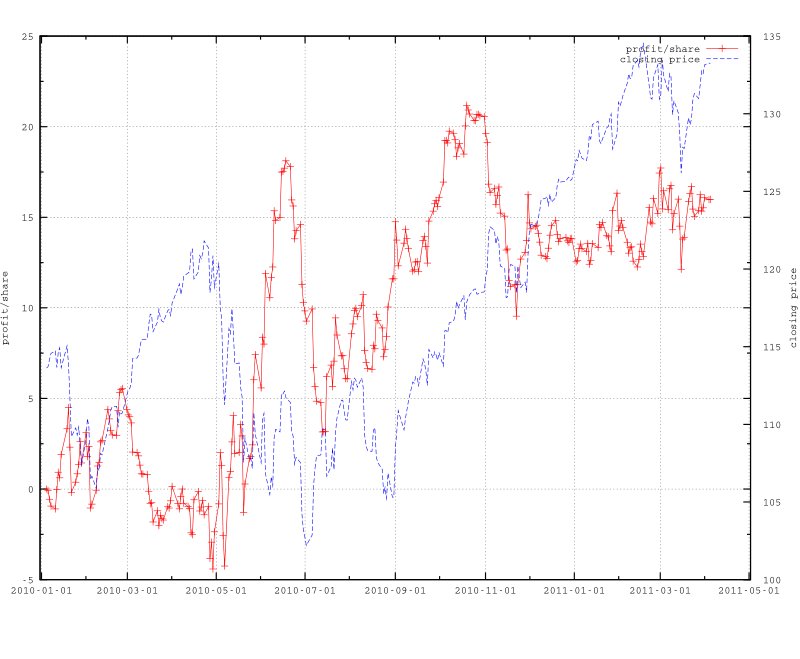
Figure 4.1 Profit per share on SPY (solid line) for BOP strategy with close-to-close (no transaction cost).
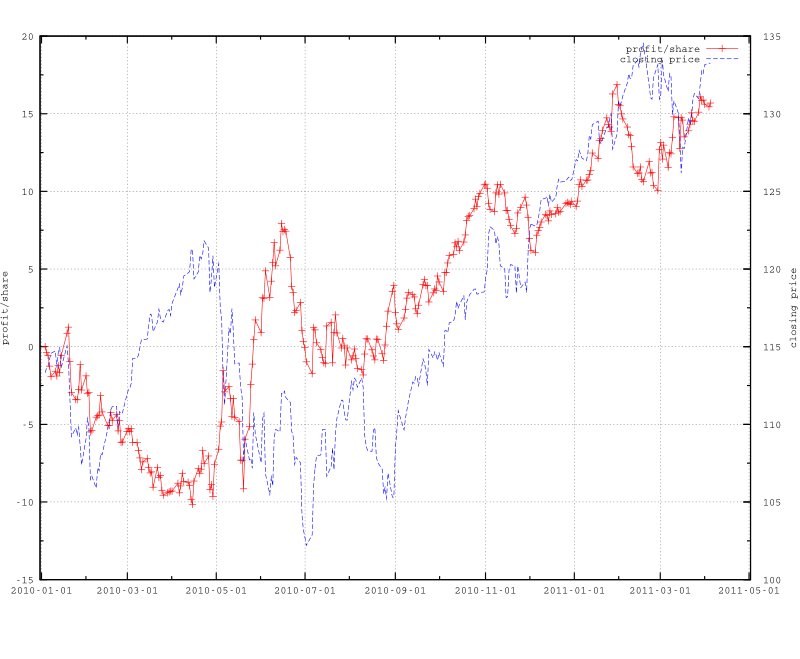
Figure 4.2 Profit per share on SPY (solid line) for BOP strategy with open-to-close (no transaction cost).
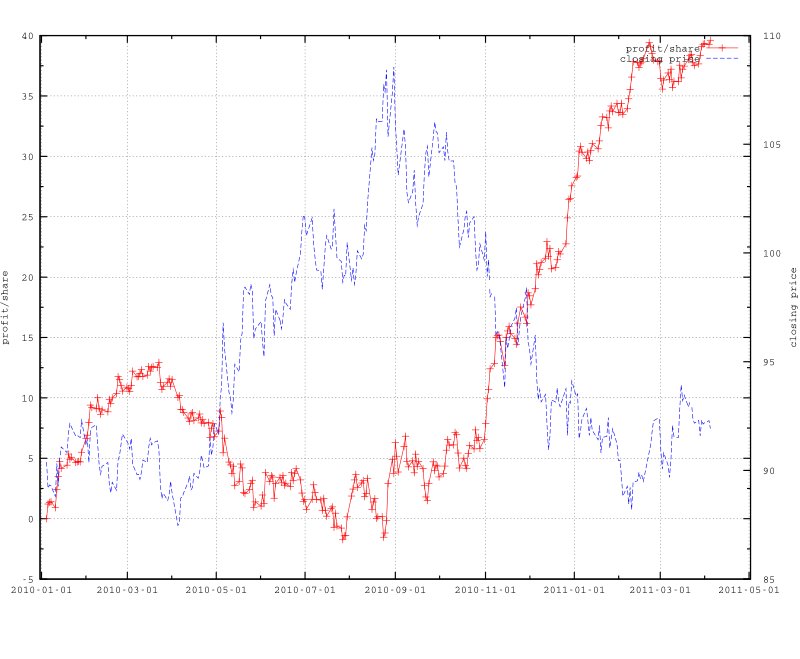
Figure 4.3 Profit per share on TLT (solid line) for BOP strategy with close-to-close (no transaction cost).
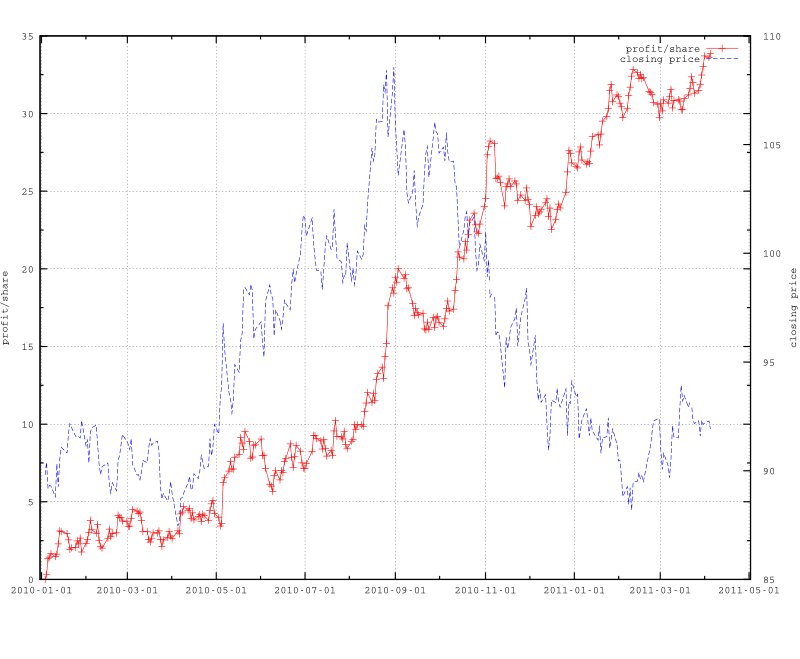
Figure 4.4 Profit per share on TLT (solid line) for BOP strategy with open-to-close (no transaction cost).
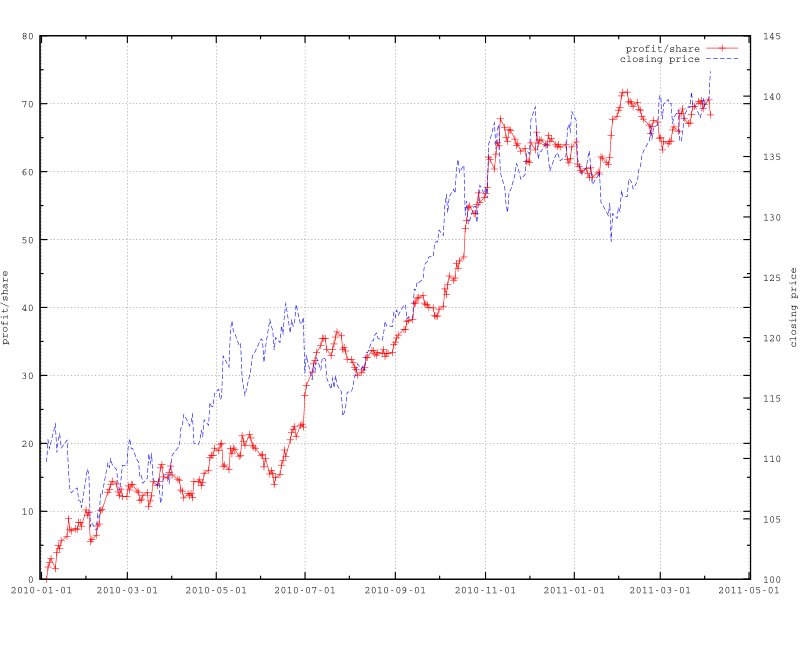
Figure 4.5 Profit per share on GLD (solid line) for BOP strategy with close-to-close (no transaction cost).
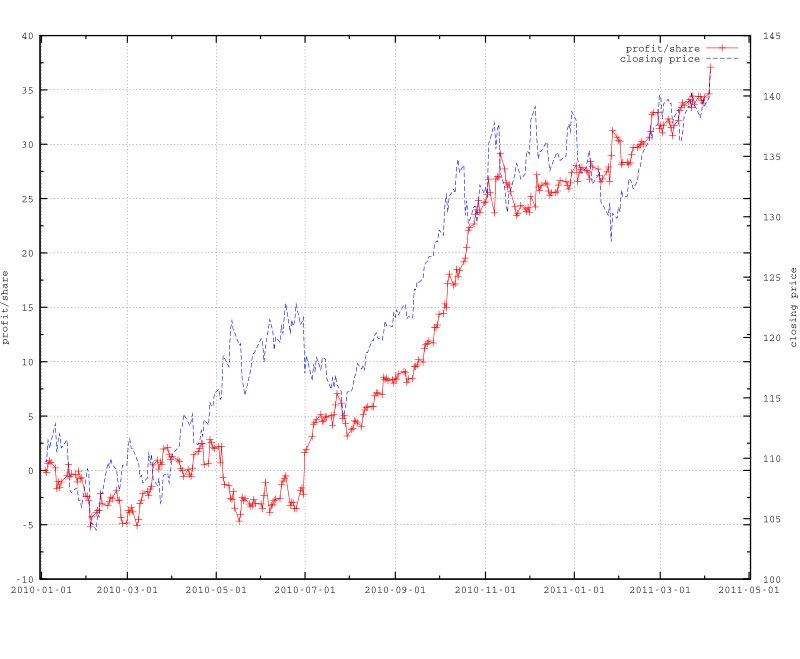
Figure 4.6 Profit per share on GLD (solid line) for BOP strategy with open-to-close (no transaction cost).
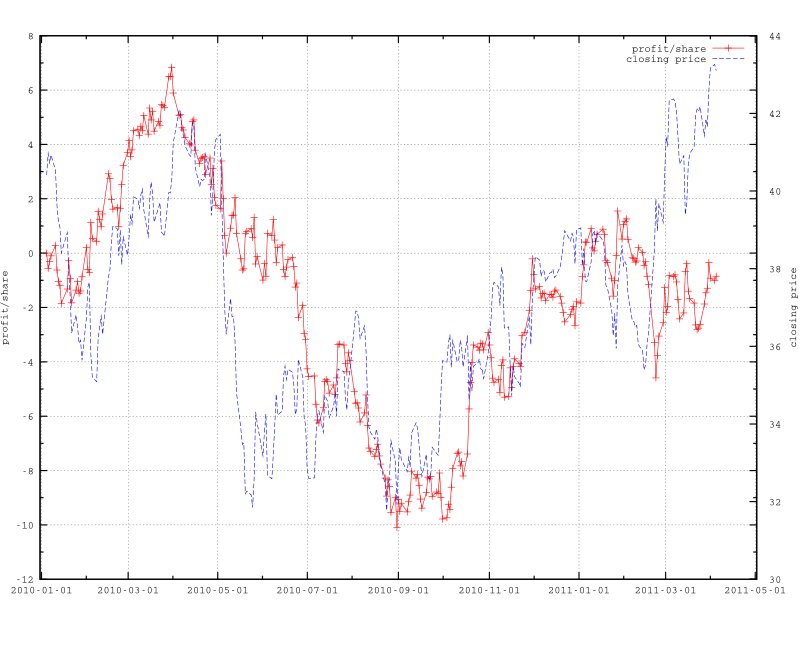
Figure 4.7 Profit per share on USO (solid line) for BSP strategy with close-to-close (no transaction cost).
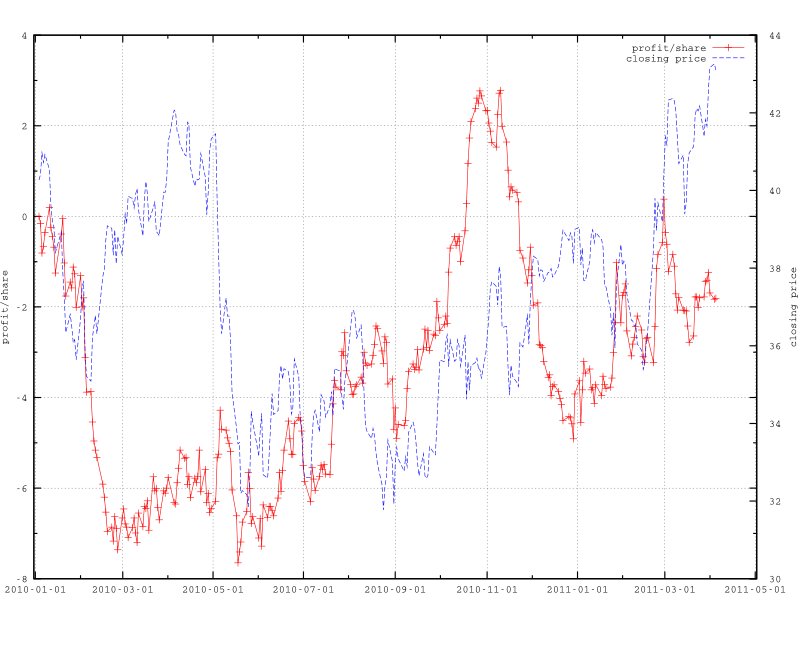
Figure 4.8 Profit per share on USO (solid line) for BSP strategy with open-to-close (no transaction cost).
Figure 4.1 shows close to close trading on SPY using the BOP strategy. The period covered runs from the beginning of January 2010 to the beginning of April 2011. During the first two weeks of January 2010 the strategy does quite well with a profit of almost $5 per share while SPY oscillates and declines a bit. After this the profit oscillates wildly as SPY declines and recovers a bit. At the end of February we have a profit of over $5 while SPY is down over the same period. From March to the beginning of May the strategy does poorly while SPY climbs steadily. From May to the middle of June the performance is spectacular with a profit gain of well over $20 while SPY declines with a great deal of volatility. July to the beginning of September is a period of volatility for both SPY and trading profits but still September begins with a profit of $15 while SPY is down for the year. September to the beginning of November does well with another $5 increase in profit with SPY also rising steadily. Profits then decline a bit and oscillate around $15 until the beginning of April 2011. Overall a constant BOP strategy does rather well for the period but there are times when switching to a BSP strategy would have helped profits.
Figure 4.2 shows open to close trading on SPY using the BOP strategy. Over the entire period the performance is similar to the close to close trading shown in figure 1. It is interesting to note however that the maximum loss here is -$10 while in figure 1 it is only -$5. Also the peak profit here is just over $15 while in figure 1 it is just over $20. So while the end result is about the same, there is a larger maximum loss and a smaller maximum gain over the period when using open to close trading instead of close to close.
Figure 4.3 shows close to close trading for TLT using the BOP strategy. For the first four months the strategy does extremely well, gaining a profit of almost $13 while TLT declines somewhat over the same period. Profits then begin a decline until around the end of August where they become slightly negative. TLT increases steadily over this same period. At the beginning of September TLT begins to decline, reaching a low point around the beginning of February 2011. Profits over this period rise dramatically, going from slightly negative to almost $40 at the end of March 2011. Overall the BOP strategy seems to do somewhat poorly when TLT is rising but it does spectacularly well when TLT is falling. Using BSP while TLT is rising and BOP while it is falling would seem to be optimal. Figuring out when TLT is in a rising or falling mode is the challenge.
Figure 4.4 shows open to close trading for TLT using the BOP strategy. The performance here is almost too good to believe. The profit remains positive over the whole period. It is interesting that the profit climbs during both the rising and falling periods of TLT. The one drawback is that the profit tops at about $35 while with close to close trading it tops at about $40. Why there is such a difference between close to close and open to close trading for TLT, using the same strategy, is something that bears further investigation.
Figure 4.5 shows close to close trading on GLD using the BOP strategy. The performance of the strategy is quite amazing. Starting in January the profit climbs $10 while GLD declines over the same period. By the beginning of March profits are up to almost $15 while GLD is down. Not much happens until the beginning of July when profits climb and peak at about $35 during the month while GLD is up only a little under $6 for the year. Starting in September profits begin an almost relentless climb to about $68 by early November. GLD also climbs over this period and peaks at $137.78 on November 8, up $28 for the year. For the rest of 2010 and early 2011 there is not much change with profits peaking a little over $70 in early February 2011.
Figure 4.6 shows open to close trading on GLD using the BOP strategy. The performance here is much worse than the close to close trading shown in figure 5. Profits end the period up about $37 which is far below the almost $70 for close to close trading. There is also a maximum loss of about -$5 while there is never a net loss with close to close trading.
Figure 4.7 shows close to close trading for USO using the BSP strategy. The overall performance is not very good. The profit peaks at about $7 in February 2011 with USO up only about $1 over the same period. From here however, things get ugly with a steady fall in profit to a bottom of about -$10 in September 2011. USO itself declines almost as much over the same period. Things then pick up a bit and we are at a profit of almost $2 at the beginning of February 2011 while USO is still down from January 2010. USO now begins a sharp upward climb while profits decline for an ending loss of about -$1. Neither the BSP of BOP strategy seems to work well for USO.
Figure 4.8 shows open to close trading for USO using the BSP strategy. The performance is horrible. Things decline from the start with the low point occurring in May 2010 at loss of almost -$8. From here things climb to a maximum profit of about $3 in November 2010. Things decline again and we close the period with a loss of about -$2 while USO is up. Using these simple strategies would not have worked well for USO. Something more sophisticated is needed.
Table 4.1 ranks the final profit/share (rounded to nearest dollar) for the plots of figures 4.1 through 4.8. The best performer was GLD at $68 per share using BOP and close to close, shown in figure 4.5. Second best was TLT at $40 per share using BOP and close to close, shown in figure 4.3. GLD comes in again at number 3 with $37 per share using BOP and open to close, shown in figure 4.6. TLT reappears at number 4 with $34 per share using BOP and open to close, shown in figure 4.4. Note that the top 3, over the long term, either match the trend of the price, or go against the trend. Number 4 (TLT, BOP, open to close) stands out by showing profit over the long term regardless of the price trend.
| Rank | Ticker | Strategy | Period | Profit/share [$] |
|---|---|---|---|---|
| 1 | GLD | BOP | close-to-close | 68 |
| 2 | TLT | BOP | close-to-close | 40 |
| 3 | GLD | BOP | open-to-close | 37 |
| 4 | TLT | BOP | open-to-close | 34 |
| 5 | SPY | BOP | close-to-close | 16 |
| 6 | SPY | BOP | open-to-close | 16 |
| 7 | USO | BSP | close-to-close | -1 |
| 8 | USO | BSP | open-to-close | -2 |